niedziela, 30 grudnia 2012

Malware Response with Mandiant Redline


Redline is MANDIANT’s non-commercial tool for investigating hosts for any intrusion activity, and malware. It analyzes files and memory, making a threat assessment profile at the same time.  In just a few words great tool for live incident response, and data analysis. Instead of manual live data acquisition (manual approach is a bad idea anyway), we can use Redline Collector for volatile + non-volatile information collection – possible adding IOC-  and then quick analyze on investigator machine also automatically (with support from white lists and MRI). At the same time, results can be confirmed using Memoryze or Volatility, for more ‘controlled’ study. Below just quick description of Redline’s modules or features.

Rapid Triage:
Without need for installation and alteration to the system state, one .bat script can be run on the subject host. It audits all processes, driver, network connection. What is more Redline Triage can be used for file structure capture and memory dump. Great for live response for volatile data.

Reveals Hidden Malware:
Collector is capable of memory imaging and deep study. It works on the level of kernel, so malware(rootkits, hidden processes) that are present in the memory (possibly not on the disk) can be seen and become obvious.  

Guided analysis:
Below description taken from guide, presents the ideology of Redline, and purposes. The statement  “takes the guesswork out of the task and time allocation” is so true, and perfectly shows that the memory inspection or intrusion detection process is not an easy task.

MANDIANT Redline streamlines memory analysis by providing a proven workflow for analyzing malware based on relative priority. This takes the guesswork out of task and time allocation, allowing investigators to provide a focused response to the threats that matter most. Redline calculates a “Malware Risk Index” that highlights processes more likely to be worth investigating, and encourages users to follow investigative steps that suggest how to start. As users review more audits from clean and compromised systems, they build up the experience to recognize malicious activity more quickly.

Investigative Steps:
Another great knowledge goes from Madiant. It is obvious, but I really like when developers and IT Security pros recommend training and learning.

Redline can collect a daunting amount of raw information. The key to becoming an effective investigator is to review Redline data from a variety of “clean” and “compromised” systems. As you gain experience, you will learn to quickly identify suspicious patterns.

Malware Risk Index Scoring and MD5 Whitelisting:
Redline during deep analyze uses its rules and techniques to calculate MRI for each task in the capture memory dump/ live data. That MRI uses different colors to demonstrate risk. Of course there will be some false positives or false negatives, but Redline gives also an easy way for tuning. Furthermore, majority of processes are legitimate and standard. MANDIANT has made MD5 hashes for multiple OS’es  and its components. Whitelisting allows to filter out tons of information that are known and unaltered – definitely not interesting during intrusion detection process.


Indicator of Compromise (IOCs):
mandiant_ioc_finder.exe can be used to look for IOCs in the subject system. MAndiant has developed an open standard(xml) for defining and then sharing threat information.

Going well beyond static signature analysis, IOCs combine over 500 types of forensic evidence with grouping and logical operators to provide advanced threat detection capability.

We have several methods of data collection: Standard Collector/Comprehensive Collector/ IOS search collector. Each of them can be modified and later provide fast and predefined options for incident response. Memory image acquisition can be applied in all of them. The ‘Analyze Data” section provide several options. Simple we choose what we want to analyze (investigator workstation!) and what ‘external’ feeds should be added: do we have IOC report, or whitelist imported?


Last interesting option, nicely done:
"Analyze this Computer" option is offered only for training and demonstration purposes. It performs a robust acquisition and analysis of the local system, with options for saving the results. This is an great way to gain experience using Redline but is not recommended for investigations. For real-world use on multiple systems, follow the workflow for Using a Collector. It is important that Redline analysis be carried out on a clean and protected workstation: this is easily accomplished using the Collector to bring captured data from potentially compromised systems to a secure Redline workstation. Do not risk compromising your collected evidence!
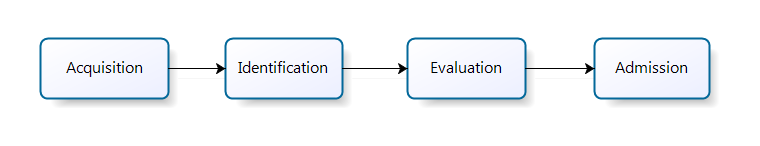
Workflow 
Process delivered by Mandiant is rather straightforward : collect, import and investigate. While collecting and importing are very easy … investigation is also simple. We have several options when it comes for collecting (do not forget about IOC finder). Here we need to create new ‘case’ and only launch RunRedlineAudit.bat. on the compromised system. Please, remember about place for acquired data!  Once data has been collected from the host it must be imported and automatically saved as .mans database file.


Investigation
Typical investigation steps contain reviewing: MRI Scores, Network connections/ports, Memory Sections/DLLs, Handles, Hooks and drivers. Here, it is worthy to mention, that when analyzing DLLs, Whitelists should be used. Here we have also set of filters. What is more, we have a bunch of tools for memory image study and acquisition. Furthermore we can acquire a driver. Another great feature is The Timeline, which provides a time-ordered list of events (use TimeWrinkle and Time Crunch for filtering). To sum up, we have a great tool with set of awesome features. For sure, I will spend days getting to know better the Redline - as it is complex solution (adding MIR) connecting incident response, malware response, intrusion detection and dead analysis. I strongly recommend reading the 'investigation' part from guide, also the appendix about best practises.  

Source for manuals, whitepapers and software (+whitelist):

For more information about the IOC standard and IOC Finder, visit http://openioc.org/ and http://www.mandiant.com/resources/download/ioc-finder/


sobota, 29 grudnia 2012

Live Response with WFT


    The Windows Forensic Toolchest™ (WFT) is designed to provide a structured and repeatable automated Live Forensic Response, Incident Response, or Audit on a Windows system while collecting security-relevant information from the system. WFT is essentially a forensically enhanced batch processing shell capable of running other security tools and producing HTML based reports in a forensically sound manner. 
   This description taken form http://www.foolmoon.net/security/wft/ wouldn’t be written better, and perfectly tell us what is the WFT. In another words, it is a light shell-program with config file that can run security tools and do it automatically and prepare html report. It supports Windows NT/2K/XP/2K3/VISTA/WIN7 and is commercial. Good presentation of this tools can be found here.


As we can read from support : The tools included in the default configuration file do not make any  significant alterations of the system they are being run on.
This tool is a great framework for incident response, and intrusion detection. On the other hand can be used by administrator for problem handling .etc. What I would like to mention, is the fact of automatization. Very often we know what information we want to collect -  it can be pslist, fport, handles .etc – and every time we want that data collected. So this part or incident response is repeatable and can be achieved with success – with WFT. What is more the output is great designed, we have it in html and  in .txt mode. Developers did not forget about documentation. Every step taken by this soft is logged and this can be seen also in the standard output. Additionally, we can track all changes made be tools, and we are prompted that some extraction can take more or less time, and what alteration is being made (which .exes/.dlls are needed). Of course all activities and scripting are with  a sound methodology, also computing MD5/SHA1 checksums.  


In another presentation this sentence can be found : WFT should be run from a CD (or USB memory stick) to ensure the forensic integrity of the evidence it collects. In addition to the WFT binary, users will also need to copy any external programs it will be invoking to the CD / memory stick. Okay.. but what about remote forensics ? I would like to end here, next I will focus on remote methods of data acquisition, and how to do it, to keep sound methodology of data collection. 

środa, 12 grudnia 2012

Live Response vs. Memory Image analysis


It will be desirable to start with some non-technical statement, given by Malin, Casey and Aquilina - before continuing to more 'digital' part of this article, namely:
“When malware  is discovered on a system, the importance of organized methodology, sound analysis, steady documentation, and attention to evidence dynamics all outweigh the severity of any time pressure to investigate.”
Here,  I would like to focus on the evidence dynamics, data preservation and collection. Other aspects - mentioned previously - are quiet obvious and probably getting more and more intuitive over time. Malware and hackers are getting stronger, and more often use anti-forensics methods to cover their actions and delete fingerprints. Just to list several examples: encryption, packing, detection of virtual environments, halting when PEB detected .etc. What is more deleting log files, flushing caches, generating fake traffic also are common and used. Another definition, the evidence dynamics, I would describe as the way that information disappears. I think that the OOV theory and this concept can be safely combined together. When acquiring evidence from subject system, we know what volatile data have relatively short life span, and any activity done by us can alter this type of information. When carelessly collecting data, also this non-volatile can be distracted, and loose its credibility. Although, there are also ways in which alteration on the system can be minimized. Checking how forensics tools are working, what alteration are they causing, what registers are used and so on, can distinguish between  malware/intruder and investigator’s tools.
Having that in mind, there are several ways of live response to the incident. To remind you, we could do live response with toolkits and frameworks, acquire memory dump, or both – depending on the situation. But okay, you may ask – what should be first? Live or memory imaging?
The more tools and processes you run, the more alteration on the system you cause. This is obvious. The situation is getting more dangerous, when investigator does not know how his tools work. At the same time these tools can crash,  and overwrite digital evidence. Tragedy. On the other hand anti-forensics methods may be applied, or even rootkit used – in this situation using system or own tools may provide fake information. What is more, when collecting data on the subject system we can overwrite another segments of file system, overwriting potential evidence. Furthermore,  sometimes we do mistakes, so omissions during investigating may happen. All listed arguments can be concluded with:

Before collecting any volatile data on the subject system, first acquire a memory dump.

This concept is strongly supported in the modern literature. In my personal opinion, I can agree that firstly acquiring memory dump we are avoiding omissions, missteps, but not surely minimizing alteration on the victim machine. University of Concordia, and one of CERTs conducted tests, in which they tried to check which method (live or memory imaging) causes more alteration on the system. It seems that impact on the system was bigger when live response was made. More pages in the system have been altered. On the other hand the difference between this two approaches was getting smaller when the newer system have been taken into account. In other source I found that new generation of tools are making less fingerprints that in years before – respectively. In my humble opinion, much remains to be done in this particular field, and many test should be conducted. For that moment, I believe that memory imaging as the first call is the best action that can be taken during incident response. 

poniedziałek, 10 grudnia 2012

Memory Analysis Tools

One of the very first step during digital investigation is the  memory imaging. I will write shortly about why it is so important, and why not to launch live incident response instead. At the same time I would like to focus on IDIP model, as in my opinion is mature, and elegant. In this article, just briefly giving reference to awesome tools for post-mortem or dead analysis of memory dumps. These tools are free, well known and strongly supported : Volatility, Memoryze and PTFinder. 


Volatility supported by Volatile Systems is the most powerful in presented set. You can just visit web page and find tons of useful information, documentation and capabilities. What is more there is an awesome text:

The Volatility Framework demonstrates our commitment to and belief in the importance of open source digital investigation tools . Volatile Systems is committed to the belief that the technical procedures used to extract digital evidence should be open to peer analysis and review. We also believe this is in the best interest of the digital investigation community, as it helps increase the communal knowledge about systems we are forced to investigate. Similarly, we do not believe the availability of these tools should be restricted and therefore encourage people to modify, extend, and make derivative works, as permitted by the GPL.
On the other hand we have a product from Mandiant - Memoryze. The is a  memory forensic software "that helps incident responders find evil in live memory. " List of features can be found here


One more tool must be mentioned. This is PTFinder. Very often Volatility and PTFinder are compared together. What is more, all of listed tools, use other technology and approach, so it is advisable to know each of them and check how they are working on specific cases - how are they different (or complementary) and what metadata can be found by these tools.


More information about PTFinder can be checked on this page. In the future - hopefully - I will present some of conclusions, how to use these tools on specific memory dump. I would like to make some kind of comparison, just to know what are the strengths, weaknesses  and capabilities of mentioned frameworks. 

niedziela, 2 grudnia 2012

GCFIM model


I did mention that I am involved in incident response process development, constantly learning something new in this field. Possible, I presented how that process can be created basing on the approach introduced by Lockheed Martin. The idea is to gather as much information as it is possible before any process can be created. Checking latest researches it seems that there are five stages of maturity of the Incident Response Process. What can be said, is the fact that digital crime is getting to be even stronger, and is it hard to still think in this linear way. We need to develop new methodologies and choose how to react when the alarm raise. For years, researches and IT investigators have been developing new phases of investigation models and approaches. I think that all sub-processes such as forensics investigation, APT response, and basically intrusion detection must be very closely combined together, and together create incident response process. On the other hand that process should be constantly developed to fit and adapt to changing threats and new technologies. Another problem could be the amount of false-positives and sophisticated attacks.  But, at the same time when the crimes scene is becoming more and more ‘digital’ and switching its place from streets into the ‘net’, the need for digital investigation appeared. Incident response process should answer questions how to behave and what to do when security controls reports policy violations or breaches. Computer forensics investigation should perfectly fit into the process and have an opportunity to develop. The clue is, how to check if the incident is legitimate, and how to prove the relevance of evidence collected on the digital crime scene? Without the process of verification and forensics approach to the alarms no  incident response process would exist. I would like to present how the process of forensics investigation looks like and hopefully describe how it is applied into incident response process.
All of above and much more have been thought years ago, when the FBI Laboratory presented the very first model of computer forensics investigation.  It was in 1984 when Pollitt introduced Computer Forensic Investigative Process.

Computer Forensic Investigative Process

In the first phase, the investigator was asked to collect evidence – in forensically sound  manner of course – identify components in the evidence and transform them to be human-readable. Then analyst checked if any identified components represented a legitimate evidence. This happened in Evaluation phase. At the end of this process all collected evidence were presented in the court of law. I suppose that this model can be freely used at the beginning of any process creation. We have preparation, analysis and outputs.  Possibly applied into SIPOC thesis. Then, many years passed and many other models have been presented. Awesome job in this field was done by Carrier and Spafford, who presented IDIP (integrated digital investigation process). I think that IDIP was the very first mature models in this field. Carrier also introduced the definition of ‘digital crime scene’ . They described the pre-preparation phases, in which appropriate personnel training and tools should be prepared. What is more, they also strongly marked the importance of security controls and detection process. Another awesome hint, in IDIP model we can find sub-processes and, division into technical and non-technical data acquisition. This version was upgraded several years after and named EDIP.

Great work was done by the team Yunus Yusoff, Roslan Ismail and Zainnuddin Hassan. They were basing of other investigation modes, and grouped together some similarities of all methods and methodologies. They proposed generic investigation process – known as GCFIM (Generic Computer Forensic Investigation Model).

Generic Computer Forensic Investigation Model

I would like to shortly described phases in this model. The first one is obvious,  appropriate preparation must be taken into consideration before any other sub-process could take place. Tools and personnel should be trained and checked. Additional steps must be taken from management authorities to support CSIRT during investigation process (privileges, access, approvals). The second step – Acquisition and Preservation – steps contain sub-processes such as: identifying, collection, transporting, storing and preserving evidence( simply collect and prepare data for further analysis). The stages analysis and presentation are easily understood phases and naturally can be divided into more detailed sub- processes. The last stage is all about mitigation, resolution and reporting.  At the graph we can notice some kind of ‘sequence’, but what is more, there is a possibility that we can move backward during investigation and having ability to ask questions one more time.
The GCFIM model is a perfect generic model, that any CSIRT and forensics investigators can start with when creating own incident response processes. It seems that the main stream or flow of this model can be easily recognizable in incident response processes – which contains forensics investigation also.  Some kind of similarity between these two models is appearing.  One of them should be very general and apply specifically to all incidents (in physical world), where particular policies and people need to be engaged, and the second one more detailed and sophisticated taking place in digital crime scene. 

środa, 28 listopada 2012

Tripwire


Another amazing information came to me. Possibly a little late, but I am pretty sure, that many IT pro’s may be not aware of this.  What is known and obvious, is that we are using SIEMs for several purposes but the most critical one is: incident detection. The problem arises when it comes to large networks, and infrastructures – there is an issue, how to separate legitimate alerts from false-positives? When it comes to large volumes of data, the problem is getting event bigger. The idea of “external feeds” or “trusted sources” I suppose is also recognisable not only by IT security guys. It says, that we are getting information not only from logs, and flows in our SIEM, but also from another data sources. As an example – we can be given with the list of privileged users that have an access to the particular host, or  alerts from consulting companies, that “watch” our company from outside. Other trusted sources can be change and configuration data. These, listed sources of information can add the context to events/flows correlation and focusing IT Security Monitoring teams only on relevant alerts. And here is the power of new approach. I would like also to write about Tripwire VIA solution – which leaded me to some thoughts. 


First of all, Tripwire company and its solutions ... are awesome. I like this kind of fascination.  Tripwire VIA platform contains three components: Enterprise (configuration management), Log Center( log – event management) and Data Mart. As Tripwire says:

“As security breaches continue to rise(...). Log collection, retention and reporting are an accepted best practice for security and mandatory requirements of most regulatory policies. For years, though, log management solutions have generated a lot of  noise without helping detect threats”

Here comes Tripwire. Deploying SIEM is not an easy task. What is more ,incident detection and SIEM maintenance is another hard task. Of course, this is not the end of problems. Another need is the fact, that SIEM should obtain the rule - “easy-to-use”. Tripwire says that have a bunch of solutions, for these issues.  One of the greatest things about Tripwire VIA solutions is its approach to file integrity. Tripwire Enterprise give a brief insight into system configuration and status (compliance). Then this information is easily correlated with Log Center and gives a context, relationship between simply logs activities and changes that occurred on subject system. This is perfect approach that attract me the most. Again, awesome. Of course Tripwire supports standard capabilities such as queries, event correlation, trending analysis and dashboarding. What is more the statement of “active data” is introduced, saying that the data can be easily accessed even if the information is older (and possibly stored "deeper"). On the other hand it supports detecting incidents, risk management and following system integrity. Furthermore, I saw the methodology of rules construction – another great feature! I cannot say if graphical creation of rules (by drag and drop) is mature or not. What I think is that the newest SIEMs are very complex and very often is hard to combine the rule you really want to deploy. There comes also the problems with optimization and documentation. So yes, the graphical rule creator is a great feature, and possibly will make the incident detection process simpler – maybe this is another layer of prevention from the system , to build more efficient and complex rules. Dashboarding is another subject, and hopefully I will cover it next time. But here, just a quick hint – Tripwire gives the opportunity to watch most relevant logs on the “event relationship diagram” presenting nodes – as hosts – and connections. It is always a great idea to watch logs or metadata in more “human” friendly way, than raw events in real time streaming mode (aka tcpdump).


Ending, just several words about Tripwire components and mechanism. As Tripwire is known – I suppose so – because of it Enterprise component – it stores the data, encrypt it and applies a checksum to ensure its integrity. In the database it can also stores the vulnerabilities data for further reference and correlation. Other features, such as alerting, multi-platform support and logsources are known. On the other hand Tripwire enterprise is integrated with ESM solution developed by Arcsight. 

In my personal opinion, system – configuration – file integrity combined with log and other metadata give great, great base of information for incident detection and intrusion detection. These changes can be anything – files, executables, configs and other. Any suspicious behaviour can be simply checked by rules and alerting, but it can be difficult in big environment(storage issues). When it comes for post mortem analysis (intrusion) or malware incident response, I think that this kind of data is perfectly showing what was going on. Of cource, there are great tools for tacking software/files behaviour, but imagine that this can be automatic and raise an alert anytime.

Additional helpful abbreviations : GRC solutions (Governance, Risk, and Compliance), FIM solutions (File Integrity Monitoring), SCM solutions (Security Configuration Management).

poniedziałek, 26 listopada 2012

Hacker's Challenge

Hacker's Challenge by Mike Schiffman is one of the best security workbook out there. The subtitle "Test your incident response skills using 20 scenarios" perfectly describes what is this book about. The book is divided into 2 parts. The first one contains 20 different incidents and case studies. We can read some kind of  information taken during "initial response", supported with logs, outputs .etc (in the printed version). What is more author interestingly write the history plot, give us information about the IT infrastructure, time frames and so on. After each scenario we are issued with several questions such as "How the intruder broke into?", "What is significant about some files" or "What vulnerability was used".


The second part of the book - the most interesting - are the answers or correct responses to the incidents. There we can find great set of definitions, explanation of logs and clues. Furthermore, author is also saying what prevention should be used to avoid such situations in the future, or information about mitigation. Personally I am finding a lot of fun exercising and exploring different kinds of incidents with this material. Hopefully there are several vulumes of the "Hacker's Challenge". Happy to recommend. 

niedziela, 25 listopada 2012

HBE analysis - part 1


Just to remind you, during digital investigation we are supposed to gather two types of documentation. The first one - not-technical – is taken during initial response. The investigator is looking for any information that can be taken on/near the crime scene. He or she is checking IT infrastructure, personnel and circumstances.  As an example, imagine that you make a call to your support saying that your app is not working properly. As usually they call back you the next day, informing that they need logs, screenshots or any information presenting in what circumstances your application was, when you faced problems. And it is too late. So, yes, the purpose of not-technical information is to take any data presenting when the incident happened, what was the IT infrastructure status, what personnel was involved and so on. Believe me or not, sometimes this information is the clue. Moving forward. On the other hand we have technical stuff, which can be divided into NBE and HBE. I am pretty sure that the first one was well presented before – and I will be back to it in the future – but now, I would like to focus on the Host Based Evidence. So what does mean HBE?


This is simply a collection of information gathered in Live incident response process. I can say that also memory-imaging (disk imaging) is part of live response – sure – one of its subtypes. Host based evidence is set of : logs, documents, files, records, network connections, routing tables, list of processes, libraries and so on. This is all that can be obtained from machine and not from network nodes that are nearby.

There are several ways of HBE acquisition :
a) Live Response (involves several approaches and also data acquisition for post-mortem  analysis)
b) Forensic Duplication (Digital Archeology and Malware Investigation)

In this article I would like to write how the Live Response(apart from the circumstances such us intrusion detection process, malware, or simply troubleshooting) looks like. What is more, there are several tools(commercial) that can perform live response on remote machine without any knowledge from the investigator. Here I want to present what information should be obtained from the subject host, and what tool will be helpful. I would like also to remind, that there are myriad of software that can be used, and appropriate training should be taken by investigator. I strongly recommend reading several books for data acquisition, computer forensics or even file-system investigation. Please, refer to the short table of contents:

         Prerequisites
         Soundness (mention anti-forensics)
         Good practices
         OOV theory
         Data Acquisition
         Why Live?
         Summarize

Everything you do during investigation must be planned and follow clear methodology. You don’t want to launch panic mode,  and find yourself somewhere between broken documentation and destroying the subject system. On higher levels of maturity during incident response, investigator is supposed to adjust his thinking and tools to achieve as much as it is possible. By saying achieving, I mean obtaining ‘correct’ information and follow clues in the process of problem detection. After reviewing all collected data or during this process investigator will find him (or with CSIRT) in situation where appropriate response strategy should be taken. Also if it is possible, other information can be checked and collected. Please refer to previously posted article. From this short paragraph, it becomes more visible that we need to find the plan, formula that we should follow during  investigation. I would strongly recommend finding additional information about incident response process from process modeling view, and check what I have written previously.

When we talk about live system and data acquisition we need to know, that everything we do on the system is changing itself somehow.  It is very hard task – but possible – to check what alternation is made by investigator when executing commands or launching programs. In literature we can find “forensic  soundness” statement, and following “anti-forensic” actions. Please also check what does mean “evidence dynamics”. Very interesting subject. Saying that, we can fluently move to OOV theory. This abbreviation can be simply resolved into Order Of Volatility introduced by Farmer and Venema. What it shows, is the theory, that every information is stored in operating system in different layers or storages as on the screenshot below. It presents how long “each information” is alive – what is the live expectancy of the data. It must be taken into consideration when acquiring any information from any OS.


And, please… Never – I mean never – forget about documentation. Build your documentation carefully, take notes, screenshots, files .etc and you will quickly notice how beneficial it is.


In the very newest literature you can find, that by automatizating the process of volatile data acquisition we can save time, avoid misunderstandings, failures and the soft will do the job for us! During data acquisition process itself, several things must be pointed out. Think about, what access to the subject machine you have(is is local or remote? What privileges do you have, or even further what are the infrastructure restrictions – what protocol can be used?). Then, how to establish trusted connection, and what tools can you use? Is it possible to transfer your software?  Lastly, how to persevere volatile evidence, how to get them and  what next?  

wtorek, 20 listopada 2012

ThreatSim

Guys, another awesome approach presented by ThreatSim company. There are tons of ways in which attacker can compromise any company or data. There are variety of sophisticated attacks, such as low-and-slow, several types of sabotage, espionage or  high-level "open" intrusions. Then, going through some kind of automated programs (or self-propagated code), such as trojans, viruses, rootkits, parasitic viruses we are facing the problem of massive or distributed attacks. We know about DoS, pharming, spam, spoofing and finally phishing. Guys from ThreatSim, know how to handle the last one : phishing.


When standard phishing involves mass-mailing, spear phishing is in rather small scale, but is better targeted. Here ThreatSim company have lots to say about. They believe (and they have documented that!), that educating end-user is always the  best step in prevention but not the last one.

ThreatSim is an immersive training and assessment solution that defends your organization from phishing attacks by teaching users how to identify and avoid phishing emails. Our SpearTraining method targets users with bad behavior by delivering training when they click on a simulated phishing email.ThreatSim enables you to run simulated phishing attacks against your employees on a regular basis in a safe and controlled manner. ThreatSim’s SpearTraining is delivered to the user when it will have the most impact: at the moment of simulated compromise.
They deliver a solution for personnel education and taking care of any vulnerabilities in browser and its plugin (Adobe, Java, Flash, SilverLight). What is great about them, they know that it is very easy for not-IT guy(or even for him - not intentionally) just to click on the delivered link or any other feed. It's obvious, and very often we can cautch ourselfs just doing so. ThreatSim made a step ahead, and is focusing also on the minutes after being compromised - how to behave after being owned, what to do, and how to reduce the impact ? They can answer these questions.

Educating users is critical and an integral weapon in the war against spear phishing. If traditional information security is putting out fires, SpearTraining with ThreatSim means teaching your people not to play with matches.(...)The attacker is human. The user is human.


To sum up, it is believed nowadays that massive-type attacks on human is the most effective way of compromising sensitive data in company. It seems that not only patching, tons of other layers of protection, and best security support can protect your company. The keys are ...  staff awareness and education. Keep an eye on it!

poniedziałek, 19 listopada 2012

SophosLabs

In the subject of software vendors, there are several products looking very good. One of them - Sophos - attracted me - because of its great documentation, articles and being awarded by Gartner as one of the best UTM solution.  


Founded in 1985 Sophos become a known  developer and vendor of security software and hardware. It is said to be a "Complete security form products that work better together", and includes : endpoint threat protection (client firewall, network access control, web filtering, application protection, and patch assesment). What is more it combines data, email, web and mobile protection. At the same time Sophos says that has the best support in this industry - introducing SophosLabs as the global security experts and supporting group. Please, check here for products

About SophosLabs:
"Our analysts cover every area of IT security with an integrated system tracking malware, vulnerabilities, intrusions, spam, legitimate applications, legitimate and infected websites, personal data formats and removable device types"
,for more info go here

Going back to  Unified threat management ,which stands for being a solution that combines and performs different task of firewall, such as network filtering, network intrusion prevention, AV, access control list, load balancing, and DLP - I find that Sophos is the Leader in this industry.

"The Leaders quadrant contains vendors at the forefront of making and selling UTM products that are built for midsize business requirements. The requirements necessary for leadership include a wide range of models to cover midsize business use cases, support for multiple features, and a management and reporting capability that's designed for ease of use. Vendors in this quadrant lead the market in offering new safeguarding features, and in enabling customers to deploy them inexpensively without significantly affecting the end-user experience or increasing staffing burdens. These vendors also have a good track record of avoiding vulnerabilities in their security products. Common characteristics include reliability, consistent throughput, and a product that's intuitive to manage and administer"
Found in Gartner recognizes us as a Leader in the 2012 Magic Quadrant for Unified Threat Management.


As I have mentioned before, Sophos produce very interesting materials on the net (check this). One of them in really old-school form, but anyway - still presenting very good and compressed knowledge. Thanks !! 

niedziela, 18 listopada 2012

NBE analysis


What need to be remembered is  that incident response appears when the standard, or automatic security controls fail. We have tons of network/security appliances in our companies, tons of false-positive alerts and very often sophisticated malware or attack occurs and shows where do we have a security gap.

NBE is the information that is gathered (or can be reactively) from network nodes such as routers, DNS servers, taps, hubs .etc. This is all packages that can be catched by any network device  supported with  standard formats. This is all information that can be found in network traffic. It allows confirming and determining whether incident occurred or not. In another words this is the type of data that is complementary to information obtained from live response – usually only this data is available. 


There are 4 types of NBE information that can be taken from standard network traffic.

       a)      Full content data
         Consists of packages payload ,the entire content can be read depending on the use of 
         encryption. 
        
       b)     Session data
        This in nothing else than the aggregation of packages. Odd traffic can be easily  
        noticeable. We get  information about protocol, source/destination IPs and ports. The best
        way to  check what  happened  after attack.  

      c)      Alert Data
        IDS is programmed to recognize patterns of bits, specific  sorts of malicious activity,
        and other traffic that matches any signs of violations.

      d)     Statistical Data
        What we get is simple summarize  of traffic obtained in specific time   
      frame. There are  values describing percent of protocols used, number of packages  
      transported and so on.  


How to analyze network based evidence in post-mortem approach ? I am listing and shortly describing tools that will help us achieving this goal.
     
Statistical Data

Tcpdstat is a simple and powerful tool for creating summarize and statistics for traffic found in tcpdump (or other sniffing tool supporting libpacp).

Output will give us the idea about - how big and how long trace do we have, what protocols have been used, how many packages transported and the sizes.

tcpdstat evidence.raw  > output /statistical_output.txt


 Alert Data

 Alert data are taken from Intrusion Detection System. It depends how are we obtaining NBE –   
 reactively or proactively – but here we gonna check how to use snort in batch mode.
 snort -c  /etc/snort/snort.conf -r /home/user/NBE/evidence.raw -b -l /var/log/snort/
 Using this command we are telling snort just to act as a standard IDS, but in this case as input we are using previously acquired traffic dump. Also /etc/snort/snort.conf need to be set up correctly and be filled with directory to Snort rules. As output we are getting two files :

a) Alerts
b) Snort log file - presenting packages in which snort found suspicious patterns

Documentation : http://www.snort.org/

      Session Data
     
Using tools such as argus or tcptrace we can recreate sessions established from raw traffic dump. The output will be simple and showing the time frame, protocol, source port, IP with destination, and state of connection or reply and bytes transported.

Recreating with Argus :

argus -d -r /home/user/NBE/evidence.raw -w evidence.argus

Next runnning argus client ra to view session data in text format:

    ra -a -c -n -r evidence.argus > captured_session.txt

 Please, check also the possibilities supported by tcpdump:

tcpdump -n -r evidence.raw > evidence_full_session.txt 

 To build the session data tcptrace can be used:
tcptrace -n -r evidence.raw  > session_data.txt

        Documentation and Download : http://www.tcptrace.org/http://www.qosient.com/argus/.


     Full Content Data

       In this part, we are checking what details are hidden in the raw packages – after following clues found in previous layers of NBE. Firstly, we can easily use tshark to convert raw traffic evidence to more readable and human friendly format :

      tshark -x -r evidence.raw > fullcontent.raw

       The output will show us from which communication is every package (session data available), presenting data in hexadecimal and ascii format. Here we are looking for “known” patterns or supporting information for our previously found clues.

       We can try to literally recreate full sessions from the raw file. Within session data, the only thing done with tcptrace was the list all session information. Here we gonna build the session one more time, and view all information transported between hosts.

       To maximize usefulness of this evidence we can filter what we are looking for. Imagine, that you had found some suspicious behavior on port  5454 or 2323. To recreate session use:

      tcpflow -r evidence.raw port 5454 or 2323

       As the output you will be given with 4 files, or 4 session. Examining them will give you any information that was transported between hosts.
   

       For other related tools please visit this page : http://www.tcpdump.org/related.html